
Bitcoin (BTC) surged above $96,500 on February 20, but daily price action has generally remained in a sideways range as traders wait for a catalyst to trigger a new trend. The longer the sideways period, the stronger the subsequent breakout or decline.
CryptoQuant CEO Ki Young Ju said in a post on X that Bitcoin would remain in a bullish phase even if it fell 30% to $77,000. In a separate post on the “Quicktake” blog, CryptoQuant analyst Timo Oinonen said that a sharp Bitcoin correction “may not happen for months or even a year.”
Even as Bitcoin consolidates, some analysts are becoming more bullish on Ether (ETH). Experts at Santiment said in a post on X that only 6.38% of the total Ether supply remains on exchanges, as investors continue to move funds to cold wallets. This reduces the likelihood of a major sell-off, but they also noted that this data should be viewed as a long-term indicator rather than a short-term trading tool.
Can Bitcoin break above the key $100,000 resistance level and pull altcoins higher? Let’s analyze the charts of the top 10 cryptocurrencies to find out.
BTC Technical Analysis
Bearers pulled Bitcoin below the $94,000 support on February 18, but the long candlestick shadow shows strong buying at lower levels.
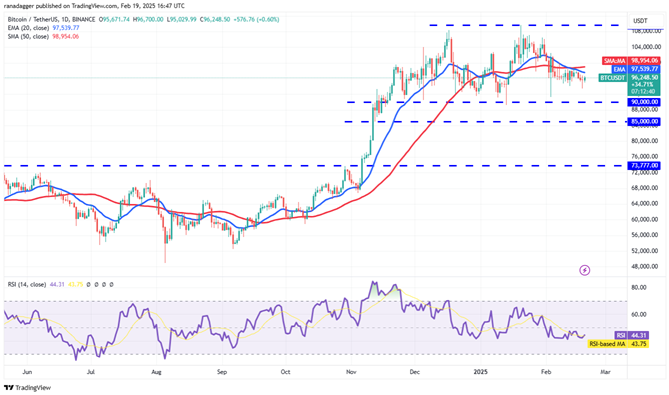
BTC/USDT Daily Chart | Source: TradingView
The 20-day exponential moving average (EMA) at $97,539 has started to trend down, and the relative strength index (RSI) is in the negative territory, suggesting that bears have a slight advantage. If the price turns down from the 20-day EMA, the BTC/USDT pair could plunge to the $90,000 support. This remains a crucial level for the bulls to defend, as a break below $90,000 would complete a double top pattern.
If the bulls want to regain control, they need to push the price above the 50-day simple moving average (SMA) at $98,954. If successful, the pair could rally to $102,500 and then $106,500.
ETH Technical Analysis
Ether has been trading below the $2,850 breakout level for the past few days, but the bears have not been able to push the price below $2,500. This shows that selling pressure is waning at lower levels.
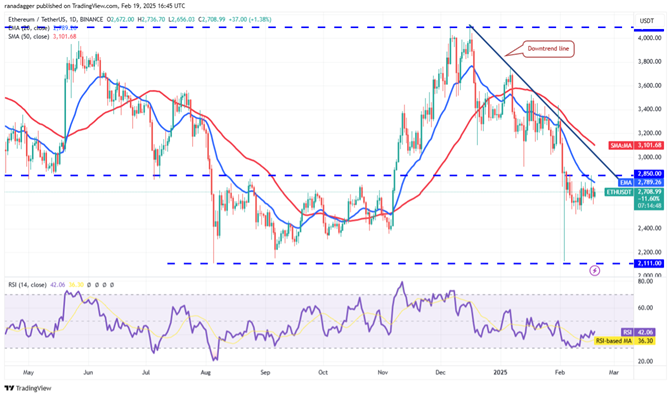
ETH/USDT Daily Chart | Source: TradingView
The bulls will attempt to push the price above the downtrend line, which is a key level for the bears to defend. If the price declines from the downtrend line but finds support at the 20-day EMA ($2,789), it will signal buying on dips. The chances of a breakout of the downtrend line will increase, and the ETH/USDT pair could climb to $3,400.
Conversely, if the price drops below $2,500, the pair could slide to $2,400 and then $2,300.
XRP Technical Analysis
XRP is witnessing a fierce tug-of-war between the bulls and the bears near the moving averages.
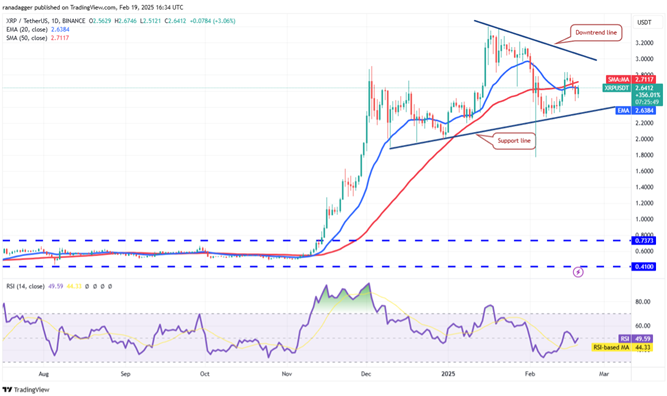
XRP/USDT Daily Chart | Source: TradingView
If the price turns down from the moving averages, the bears will attempt to drag the XRP/USDT pair below the support line of the symmetrical triangle pattern. If successful, the pair could plunge to the strong support at $1.77.
This bearish view will be invalidated if the price bounces and breaks above the moving averages. The pair could then rise to the downtrend line, where the bears are expected to establish a strong defense.
SOL Technical Analysis
Solana (SOL) plunged and closed below the $175 support on February 18, suggesting a deeper correction.
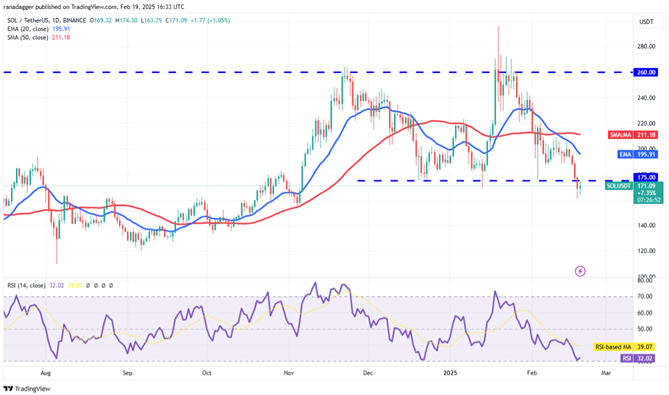
SOL/USDT Daily Chart | Source: TradingView
However, the bulls are not giving up easily. They will try to push the price back above $175. If successful, it could signal that the break below $175 was just a “bear trap”. The SOL/USDT pair could then rise to the 20-day EMA ($195) and then the 50-day SMA ($211).
Conversely, if the price turns down from $175, it will indicate that the bears have turned this level into resistance. The pair could then fall to $155 and then $133.
BNB Technical Analysis
BNB is attempting to bounce from the $635 support, indicating strong demand at lower levels.
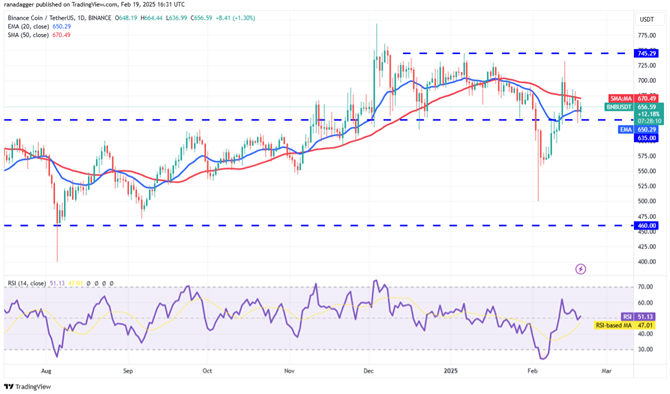
BNB/USDT Daily Chart | Source: TradingView
This recovery could face selling pressure at the 50-day SMA ($670). If the bulls can push and sustain the price above the 50-day SMA, it will signal that the BNB/USDT pair could trade in a range of $745 to $635 for the next few days.
Conversely, if the price turns down from the moving averages, it will indicate selling pressure even during small rallies. In this case, the possibility of a break below $635 increases. If that happens, the pair could slide to $596 and then $557.
DOGE Technical Analysis
Dogecoin (DOGE) price is gradually falling towards the support line of a descending channel pattern, suggesting that bears are in control.
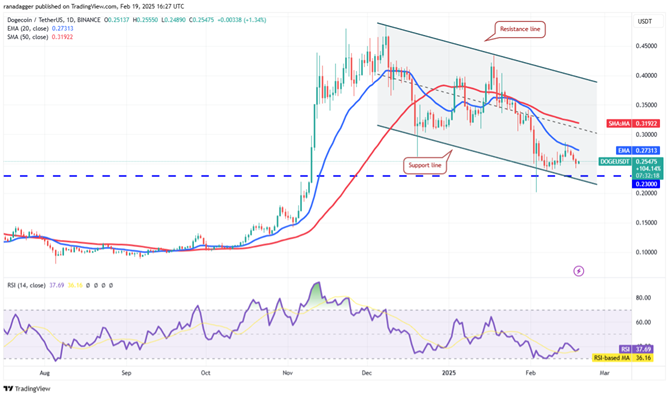
DOGE/USDT Daily Chart | Source: TradingView
Buyers are expected to defend the support line, but if bears gain the upper hand, the DOGE/USDT pair could retest the February 3 low at $0.20. If this level is also breached, the pair could plunge to $0.15.
The first sign of strength would be a breakout and close above the 20-day EMA ($0.27). The pair could then rise to the 50-day SMA ($0.31), which is expected to attract strong selling pressure from bears.
ADA Technical Analysis
Cardano (ADA) turned down from the 20-day EMA ($0.79) on February 18, indicating that the sentiment remains negative and traders are booking profits on the rise.
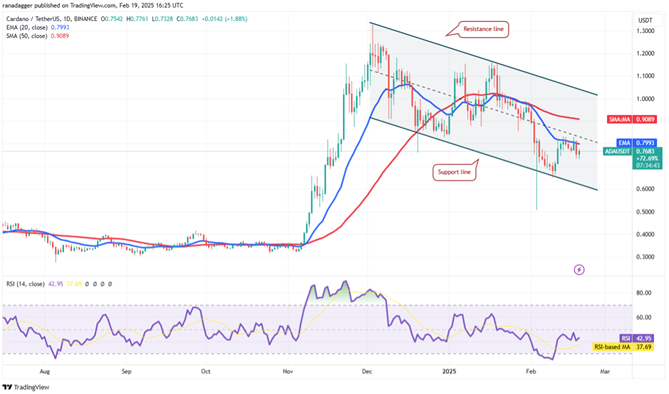
ADA/USDT Daily Chart | Source: TradingView
The bears will try to pull the price down to the support line of the descending channel pattern – this is the key level to watch. If the price breaks and closes below the support line, the ADA/USDT pair could drop to $0.50.
On the other hand, the bulls need to push the price up and sustain above the 20-day EMA to pave the way for a recovery to the 50-day SMA ($0.90). If this scenario plays out, the pair could continue to fluctuate within the descending channel.
LINK Technical Analysis
Chainlink (LINK) fell sharply from $19.25 on February 18, suggesting that the bears are trying to turn this level into resistance.
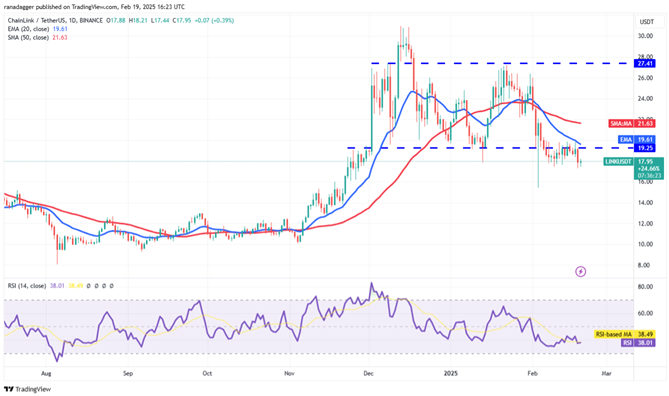
LINK/USDT Daily Chart | Source: TradingView
A close below $17 would signal a deeper correction. The LINK/USDT pair could then drop to the February 3 low of $15.40. The bulls are expected to defend this level, as a break could see the price drop to $13.
Time is running out for the bulls. If they want to regain control, they need to push the price up and sustain above the 20-day EMA ($19.61). The pair could then rally to $22, indicating that the market has rejected the drop below $19.25.
XLM Technical Analysis
Stellar (XLM) has formed a large descending triangle pattern, which will complete on a break and close below $0.31.
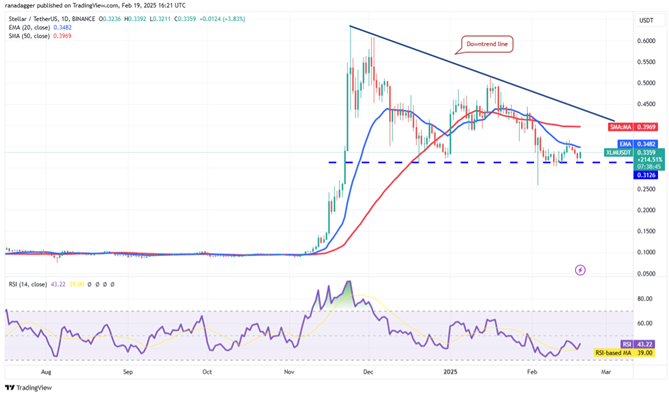
XLM/USDT Daily Chart | Source: TradingView
The downsloping 20-day EMA ($0.34) and the RSI in the negative territory suggest that the advantage is with the bears. If the $0.31 support breaks, selling pressure could increase, leading the XLM/USDT pair to drop to $0.26 and then $0.20.
Conversely, a breakout above the 20-day EMA would open the door for a recovery to the downtrend line. Bulls need to push the price above this trend line to confirm that the correction may be over.
LTC Technical Analysis
Litecoin (LTC) broke out above a symmetrical triangle pattern on February 19, suggesting that the indecision in the market has resolved in favor of the bulls.
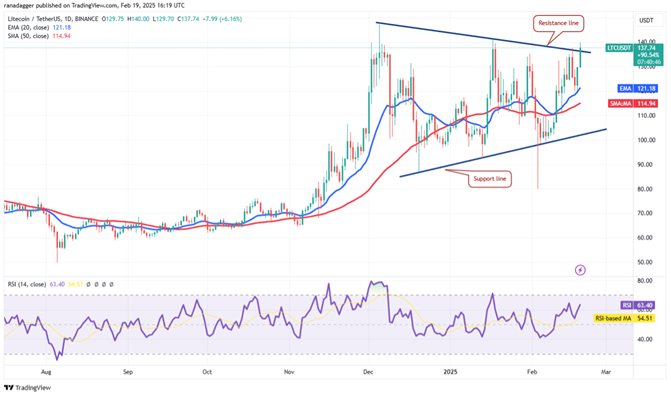
LTC/USDT Daily Chart | Source: TradingView
The upsloping 20-day EMA ($121) along with the RSI in the positive zone suggests that the main trend is in favor of the bulls. If the bulls sustain the price above the resistance line, the LTC/USDT pair could rise to $147. The target price from the triangle pattern is $197.
Conversely, if the price fails to sustain above the resistance line, it will indicate weak buying at higher levels. The pair could then retest the 20-day EMA, which is expected to act as a strong support.