
At the time of writing, Stellar (XLM) is trading around $0.33, down 2.5% on the day. Meanwhile, trading volume has also dropped 10.61%, reflecting investor caution amid uncertain price action.
However, in the long term, XLM has maintained steady growth with its total value locked (TVL) remaining unchanged since late 2024. This suggests that Stellar’s fundamentals are still solidifying, setting the stage for a potential breakout.
Technical Setup Signals Trend Continuation
Technical analysis shows that XLM is moving within a bull flag pattern, a sign of a possible continuation of the previous uptrend.
Currently, the key resistance zone of XLM is in the range of $0.35 – $0.40. This is the level that the price has been testing but has not been able to break through. On the contrary, the key support zone of $0.28 – $0.30 continues to act as a support for the uptrend.
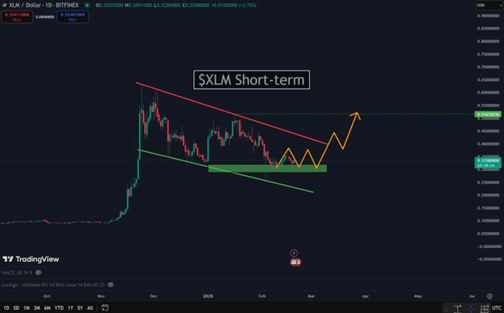
XLM/USDT Daily Chart | Source: TradingView
According to analysis from Solberg Invest, if XLM receives enough buying pressure, the price could break the $0.40 zone, paving the way for a strong growth, with a potential target towards $0.51 – an important resistance level in the past.
On-Chain Metrics and Market Sentiment
Despite the correction pressure on XLM, on-chain data still shows positive signals. The number of active addresses and total value locked (TVL) continue to maintain an upward trend since the end of 2024, proving that the Stellar network is still growing strongly. In addition, the Long-Short ratio in the past 24 hours has increased from 2.31 to 2.41 in the 4-hour timeframe, indicating that more investors are placing their faith in the uptrend of XLM.
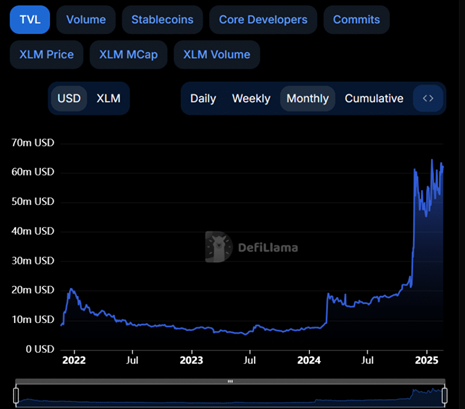
Source: DefiLlama
Where Will XLM Go Next?
Summarizing the fluctuations over the past month, the main indicators still lean towards buying signals, although the open interest (OI) has slightly decreased by 2.63% in the past 24 hours according to data from Coinalyze.
Notably, the RSI on the 4-hour timeframe has increased to 53.15, reflecting the accumulation sentiment of the market. This further strengthens the opportunity for a breakout if buying pressure continues to increase in the coming days.
If the price can break out of the bullish flag pattern with strong buying momentum, XLM can completely advance to the $0.51 zone. However, if it fails to break the $0.40 resistance level, the possibility of the price continuing to fluctuate within the $0.28 – $0.35 range is something to keep in mind.
Investors should closely monitor market movements, especially buying pressure, trading volume and price movements of XLM to have a reasonable investment strategy.