
Technical Analysis (1D & 1H): Strong Buy Signals from Historical Bottoms!
After a period of market correction, the MAP/USDT pair is sending extremely optimistic technical signals, signaling an upcoming breakout growth. Analysis on both daily (1D) and hourly (1H) timeframes shows a "golden" opportunity that no investor should miss.
1-Day Timeframe (1D): Preparing for a Strong Recovery
Looking at the 1D chart, we can clearly see: The price has bottomed out after the recent sharp decline, the MAP price has stabilized around the $0.03922 area. This is an extremely attractive price level, creating an ideal entry point with low risk and huge profit potential. The fact that the price is holding here shows that the buying force has started to absorb all the selling pressure.Increasing Buying Volume: Pay attention to the Volume column below! Although the price is moving sideways, we see that the buying volume columns (blue) are starting to appear more and are significantly larger.
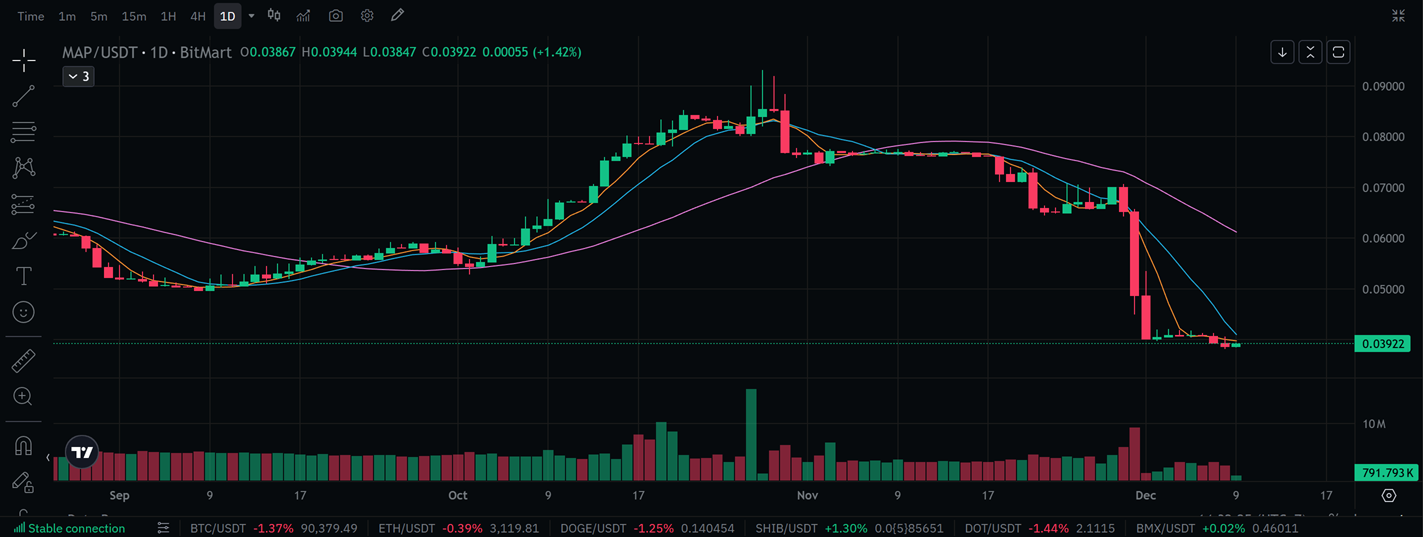
MAP/USDT 1D chart on BitMart
This proves that big investors (Smart Money) are quietly accumulating in this price zone before pushing the price up.Potential Bottoming Signal: The price is currently below the moving averages (MA) but is trending sideways and starting to pull the short-term MAs (blue, yellow) closer together. This is a classic sign of a final accumulation phase before the price line cuts above the MAs, officially confirming the new growth trend.
1 Hour Timeframe (1H): Short-Term Breakout Has Begun!Moving to the 1H timeframe, the picture becomes even clearer and more urgent:
Price Line Crosses MA Upward: Unlike the 1D, in the 1H timeframe, the price line has broken above the short-term moving averages (blue, yellow) and is heading towards the longer-term MA (purple). This is a very strong short-term BUY signal, indicating that the uptrend has officially begun.
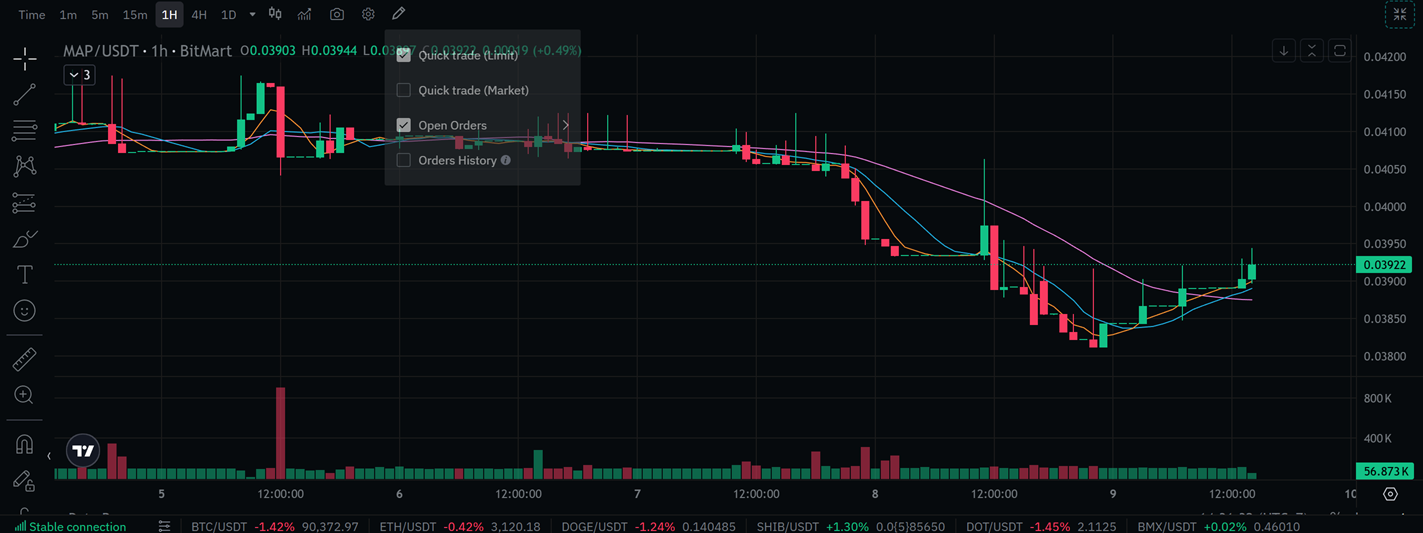
MAP/USDT 1H chart on BitMart
Bullish Momentum: The consecutive green candles appear, pushing the price from the $0.038 area to $0.03922 and tends to continue conquering higher levels. This strength shows that the market sentiment is shifting from fear to greed.
Small Resistance Breakout: The price has successfully broken through the nearest small resistance area and is creating a solid foundation to move towards higher targets.
Profit Target: With technical signals from both 1D and 1H, the profit opportunity for MAP/USDT is extremely large. Investors should set targets according to the following milestones:
Short-Term Target: Return to test the $0.050 - $0.060 zone.
Mid-Term Target: Recover the old peak around $0.075 - $0.080.
Long-Term Target: Break the old peak and move up to $0.100 and higher.
The current situation of MAP/USDT is not just a recovery, but a preparation for an explosion based on a strong technical foundation.
Social follow:
Website: https://mapscan.tech/
Website: https://mapnode.io/
Website: https://mapmarketcap.com/
Website: https://mapcex.com/
Youtube: https://www.youtube.com/channel/UCeX6536YDGDI54ghkMrkHzA/videos
Telegram Community: https://t.me/mapnodecommunity
Telegram Official: https://t.me/mapnode_official