
Hedera (HBAR) has recorded a decline of more than 4% in the past 24 hours, bringing its market capitalization to $8.4 billion. Despite a short-term recovery earlier today, the BBTrend indicator still shows negative momentum, reflecting that selling pressure remains dominant.
HBAR's BBTrend Continues to Show a Bearish Trend
HBAR's BBTrend indicator is currently at -0.71, continuing to fluctuate in negative territory since February 18. Previously, BBTrend bottomed at -6.21 on February 20, then recovered to -0.06 yesterday, but quickly fell back.
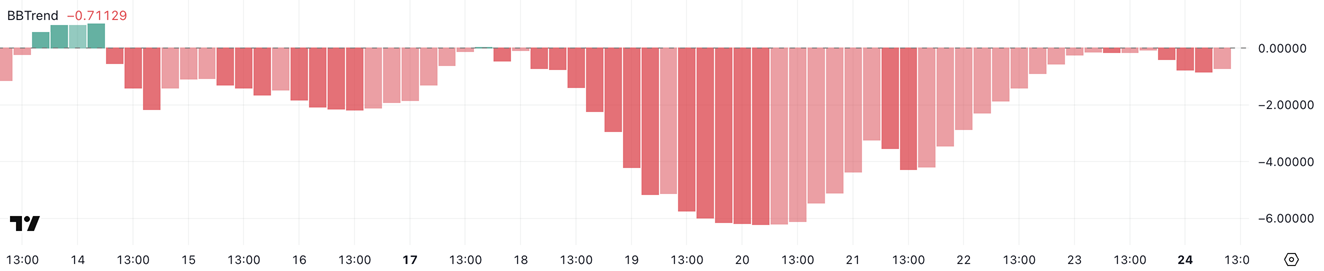
HBAR BBTrend. Source: TradingView .
BBTrend, or Bollinger Band Trend, measures price momentum relative to the Bollinger Bands. When this indicator is negative, the price tends to move towards the lower band, indicating bearish sentiment. Currently, HBAR's BBTrend has fallen from -0.06 to -0.71, indicating that selling pressure is returning after a brief recovery attempt. If this trend continues, HBAR could face stronger selling pressure, dragging the price lower.
Ichimoku Cloud Suggests Reversal but Not Certain Yet
The Ichimoku chart of HBAR shows that the price has broken above the cloud, which is usually a positive signal. However, the cloud ahead is still thin and slightly tilted downward, indicating that the resistance is not really strong.
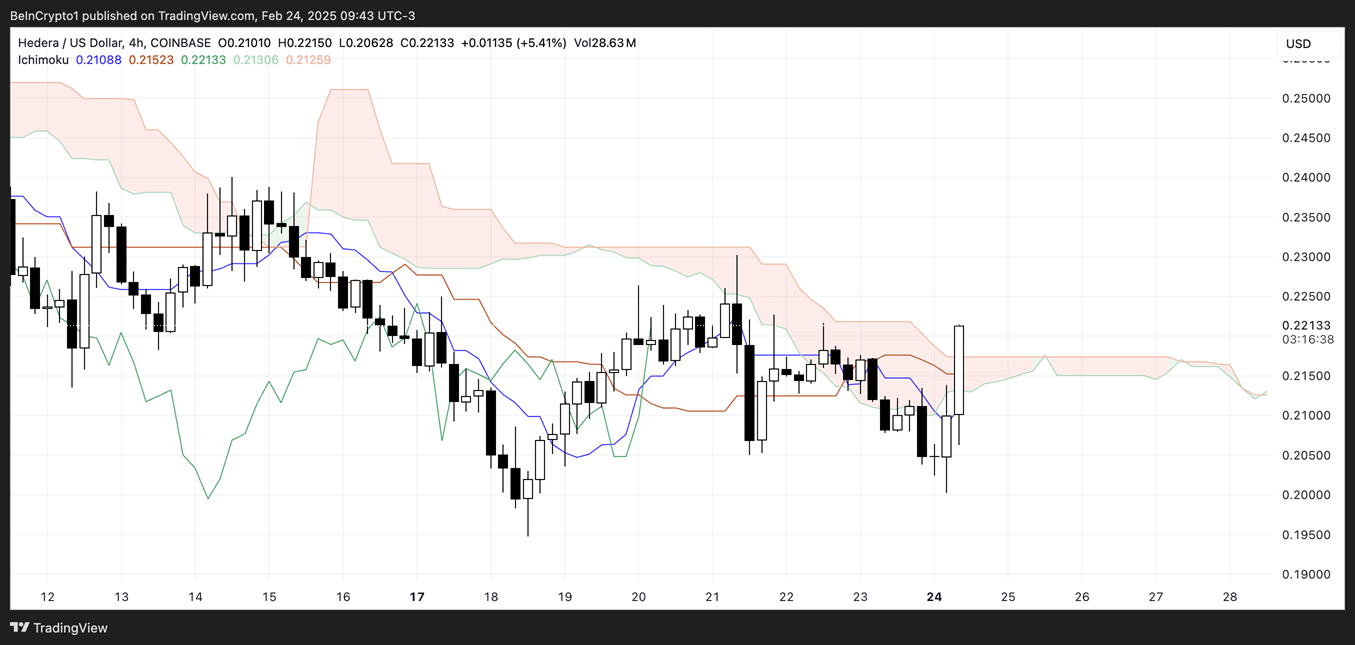
In addition, the Tenkan-sen line (blue) is above the Kijun-sen line (red), signaling short-term bullish momentum. However, the narrow gap between the two lines reflects the lack of certainty in the trend. The Chikou Span (green) is also currently above the price, indicating that the market is somewhat biased towards the buyers, but its proximity to the current candle suggests that indecision remains.
If HBAR maintains the price above the Ichimoku cloud, the bullish trend could be reinforced. Conversely, if the price falls below the cloud, the bullish signal could be invalidated, leading to a resumption of bearish momentum.
HBAR could test $0.30 if a trend reversal takes place
The EMAs show that the bearish trend is still in control, with the short-term moving averages below the long-term ones, reflecting continued selling pressure.
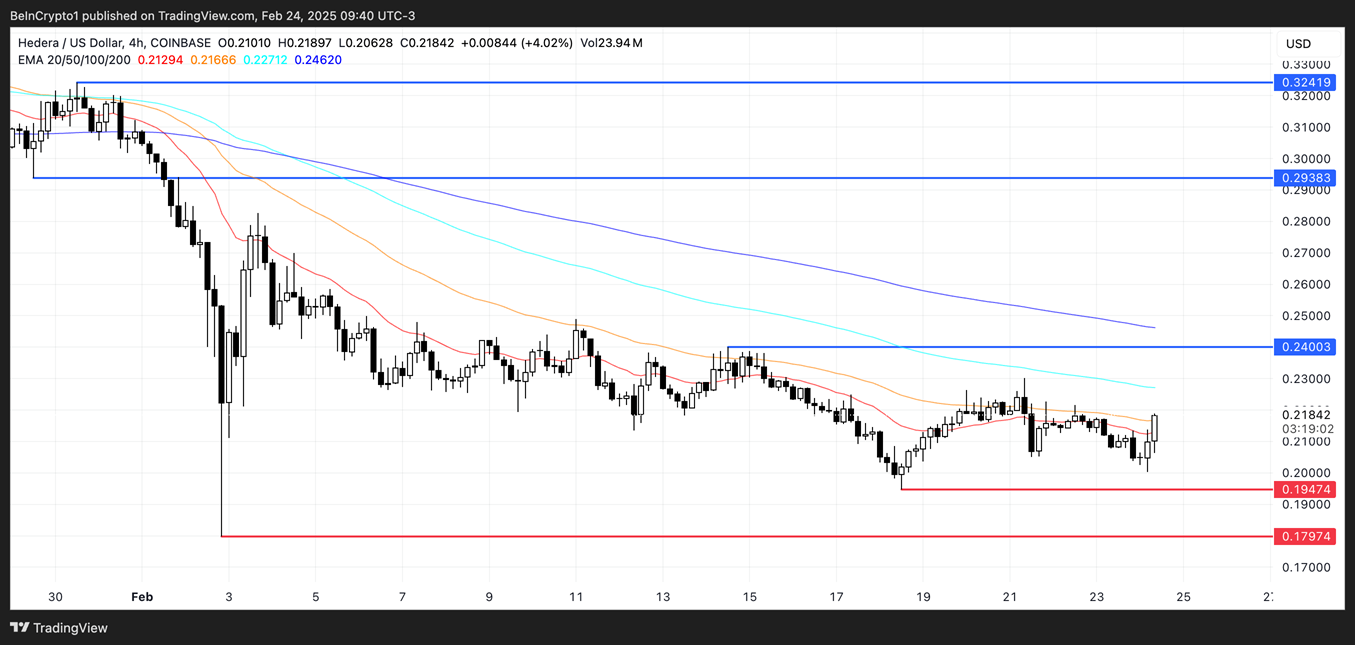
However, if the short-term EMAs cross above the long-term EMAs, it could trigger renewed buying interest, helping HBAR test the resistance at $0.24. If this level is broken, the price could rise to $0.29 and continue towards $0.32, reaching above $0.30 for the first time since February 1.
In case the downtrend continues, HBAR could retest the important support level at $0.19. If this level is broken, the bearish momentum could push the price down to $0.179, indicating that the market is still under strong selling pressure.
Summary
Although HBAR is showing some recovery signals, the downtrend is not completely broken yet. To confirm a clear reversal, the price needs to stay above the Ichimoku cloud and the short-term EMAs need to cross above the long-term ones. In this case, HBAR could retest important resistance levels and aim for $0.30. Conversely, if selling pressure continues to increase, the price could fall further towards lower support levels.