

Bitcoin is currently trading between $82,856 and $83,032 on Sunday morning, with a market cap of $1.65 trillion and a 24-hour trading volume of $15.6 billion. The intraday low was $81,629, while the high was $83,496.03, which is 23.6% below the all-time high set on January 20, 2025.
Technical Analysis by Time Frame
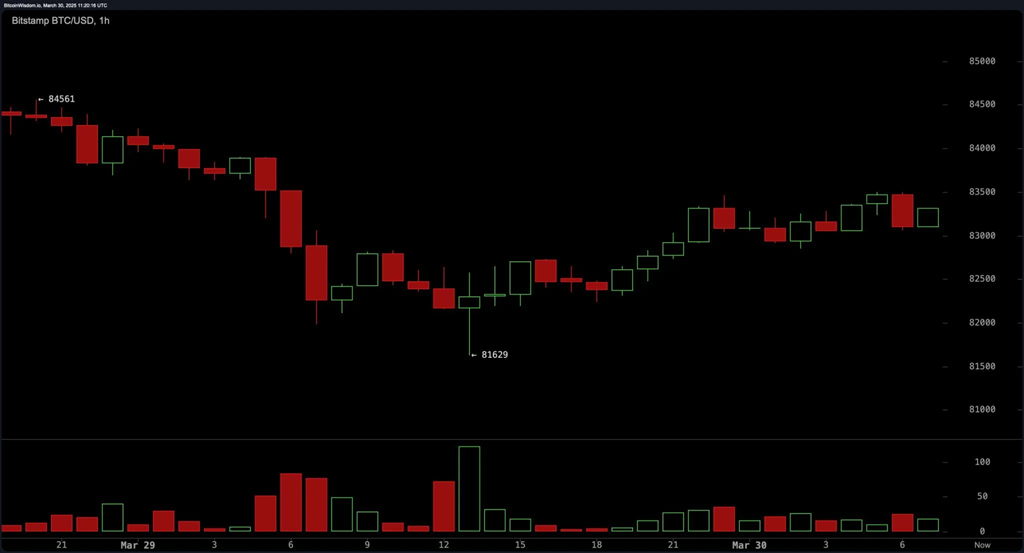
1-Hour: Short-Term Consolidation Signals
Bitcoin is showing signs of consolidation after recovering from the low of $81,629. However, the formation of lower highs and lower lows reflects a broader downtrend. The key resistance is now at $84,500, while the main support is at $81,600. The weak trading volume suggests limited participation from buyers. If Bitcoin can break above $83,500 with increasing volume, a short-term recovery could take place. Conversely, a rejection at this level could reinforce the negative sentiment.
BTC/USD 1H chart via Bitstamp as of March 30, 2025.
4-hour chart: Weak recovery with high volatility
The 4-hour chart shows that the recovery from the low of $81,629 is still lacking momentum as the trading volume shows no signs of breaking out. The strong resistance zone between $83,500 and $84,000 is a major hurdle for Bitcoin. If it fails to break above this zone, selling pressure could increase. Conversely, a strong breakout above $84,000 with high trading volume could create a buying opportunity. Traders should watch for price reaction at these zones to determine the next trend.
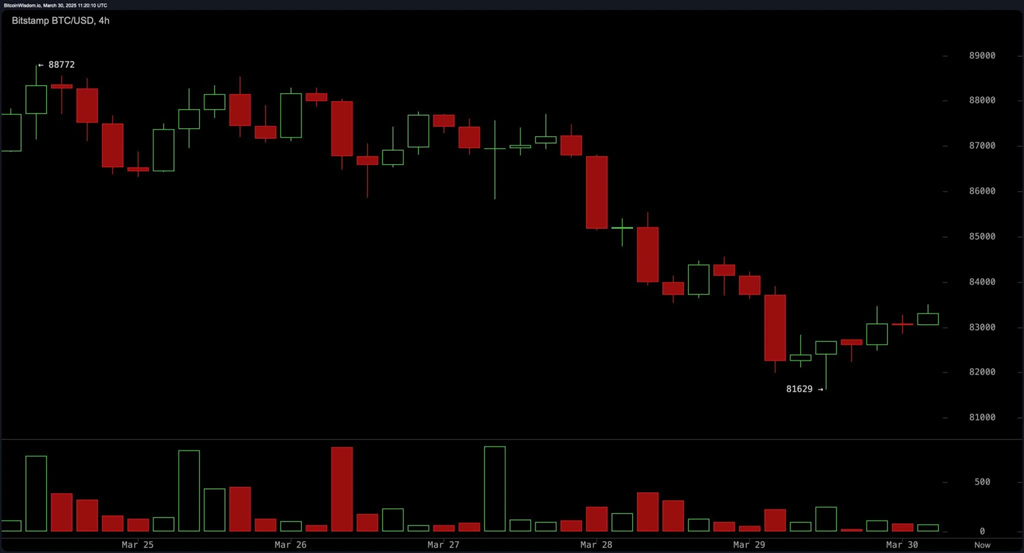
BTC/USD 4H chart via Bitstamp as of March 30, 2025.
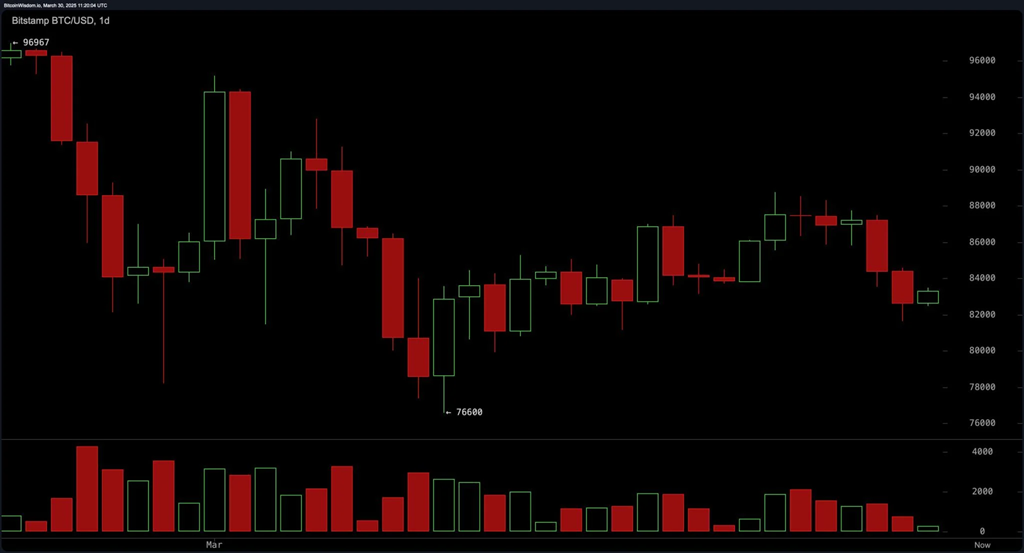
Daily chart: Selling pressure still dominates
Bitcoin remains in a downtrend after falling from a high of $96,967. Red candles with long wicks indicate overwhelming selling pressure, although there is still buying support at some points. Currently, Bitcoin is testing the $82,000 support level, which if broken, could drag the price lower. The strong resistance zone between $88,000 and $90,000 will be a major test for any recovery attempt. To confirm a reversal, Bitcoin needs to break above these levels with a significant increase in trading volume.
BTC/USD 1D chart via Bitstamp on March 30, 2025.
Oscillator Indicators: Market is indecisive
Technical indicators reflect unclear market sentiment:
- RSI: 44 (Neutral)
- Stochastic: 30 (Neutral)
- CCI: -54 (Neutral)
- ADX: 23 (No clear trend yet)
- Awesome Oscillator: -10 (Potential bearish pressure)
- Momentum: -843 (Slightly positive)
- MACD: -939 (Downtrend but showing signs of recovery)
The divergence between these indicators shows that Bitcoin is still in a weak trend, requiring more confirmation signals to determine the next direction.
Fibonacci Levels and Important Price Zones
Fibonacci levels help identify important support and resistance areas:
- Daily:
- 23.6%: $91,607
- 38.2%: $88,758
- 50%: $86,784
- 61.8%: $84,811
- 78.6%: $82,022
- 4-hour:
- 23.6%: $87,148
- 38.2%: $85,999
- 50%: $85,201
- 61.8%: $84,404
- 78.6%: $83,069
- 1-hour:
- 23.6%: $83,869
- 38.2%: $83,440
- 50%: $83,095
- 61.8%: $82,749
- 78.6%: $82,263
These areas can act as reversal or trend continuation points depending on price reaction.
Moving Averages: Bearish Trend Remains
All major moving averages reflect negative sentiment:
- EMA (10): $84,808
- SMA (10): $85,331
- EMA (50): $88,207
- SMA (50): $88,799
- EMA (200): $85,496
- SMA (200): $85,938
To reverse the trend, Bitcoin needs to break above these averages with a strong increase in trading volume.
Market View
Bullish Scenario
Bitcoin needs to break above $84,000 with a strong increase in trading volume to confirm a short-term uptrend. If successful, the next target could be $88,000. Momentum indicators like MACD and RSI need to confirm this trend to boost investor confidence. However, if rejected at the resistance zone, selling pressure may return.
Bearish scenario
The bearish trend remains dominant if Bitcoin fails to hold above $82,000. A break below this level could push the price further down, retesting lower support levels. Long-term moving averages are still showing negative sentiment, and weak buying volume could keep Bitcoin under further selling pressure.
Conclusion
Bitcoin is approaching a key resistance level at $84,000, which could determine the next trend. If it breaks out successfully, the price could head towards $88,000. However, if it fails to break above it, the downtrend could resume with a lower target. Investors need to monitor the price and volume reaction to determine the appropriate strategy.